Close

Tag Archive for: Nursing Home Compare

The New Comprehensive Care for Joint Replacement Program (CJR) Begins; What Providers Need to Know

The Comprehensive Care for Joint Replacement Program, the first mandatory bundled payment program from CMS, began April 1. Under the CJR, almost 800 hospitals in 67 geographic areas will be partially at risk for all Medicare spending related to lower joint replacements (DRG 469 and 470), from initial admission to 90 days post-discharge. Hospitals’ performance will be compared to both their historical spending and regional spending levels, which regional spending becoming increasingly important over time. In addition to meeting target pricing, hospitals are responsible for meeting minimum quality and satisfaction measures. Here’s a breakdown the methodology:

CMS Bundle Payment Methodology

With responsibilities now extending beyond discharge, hospitals need to act quickly to understand the post-acute care process. Using that newly acquired knowledge, the challenge will be to reengineer care delivery outside of the hospital walls to optimize outcomes and reduce costs. According to an analysis by Avalere, 60% of hospitals will need to reduce costs in order to remain competitive with their regional competitors. Those organizations that wait to act could very well find themselves spending the next five years playing from behind, always trying to catch up with everyone else in the region only to find themselves continuously outpaced and losing money. As many analyses have noted, too, the vast majority of variation in LEJR payments occurs in post-acute care. As a result, post-acute providers must pay particular attention to their relationships with acute care partners during the CJR rollout.

composition

(Analysis by DataGen)

It will no longer be sufficient for post-acute providers to compare themselves to others simply by looking at star ratings or occupancy. Instead, providers need to understand the current flow of Medicare patients from acute care partners through the post-acute journey, and begin benchmarking themselves against competitors based on rehospitalization rates, lower average lengths of stay, higher satisfaction, and access to preferred referral networks.

This example, from the Portland metropolitan market, shows post-acute flows from an area hospital. Using this information, PAC providers can better understand their competition and target hospitals that might benefit by referring more patients to their facility.

portland_ohsu_market
The April 1, 2016 start date has put pressure on hospitals to quickly ramp up. On the other hand, the fact that the first year (through December 31, 2016) has no downside risk may cause some organizations to take a slower pace understanding their downstream costs and challenges. This is a big mistake. Since the CJR applies to all hospitals in the geographic region, those that start early will have a continuing advantage over the life of the program.
As part of the CJR, CMS has waived certain restrictions on telehealth, gainsharing and patient support (including providing remote home monitoring technologies). PAC providers with extensive home health networks will be at a particular advantage to test out new technologies, such a tele-therapy, remote home monitoring, and active case management as an alternative to extensive skilled nursing stays and potential hospital readmissions.
For post-acute providers looking to excel in this new environment, here are some key considerations:

CJR_PAC

Without a doubt, the CJR is only the first of the mandatory bundles providers can expect in the near future. CMS will likely move very quickly to expand both the geographic reach and the DRGs of these value-based models as it looks to shift entirely aware from a fee-for-service-model. Post-acute care providers are a crucial component in the healthcare space, but they will only remain so by focusing on better outcomes at lower costs.


CMS Launches CCJR Bundled Payment Program for Hospitals and Post-Acute Care

The Centers for Medicare & Medicaid Services (CMS) recently finalized its rule for the Comprehensive Care for Joint Replacement Program (CCJR), a five year pilot program that will run in 67 regions across the country. Hip and knee replacements are the most common inpatient surgery for Medicare beneficiaries and can require lengthy recovery and rehab time. In 2014, there were more than 400,000 procedures, costing more than $7 billion for the hospitalizations alone, with the cost of surgery, hospitalization, and recovery ranging from $16,500 to $33,000 across geographic areas. This wide variation in cost, along with similar variation in quality and complication rates, led CMS to make the CCJR program mandatory for almost all hospitals within the chosen regions.

Percent of Spending by Type, MS-DRG 470

  • Index (hospital)
  • Post-Acute Care
  • Physician Services
  • Rehospitalizations
  • Other

The CCJR will hold hospitals accountable for cost variation and performance for the 90 day period beginning with the hospital admission for MS-DRG 469 and MS-DRG 470, inclusive of all related follow-up post-acute care and Part B spending.  The specific mechanism for payment places a high burden on hospitals to select high-quality, lower-cost post-acute care providers, and actively manage cases as patients move through the episode of care. While individual fee-for-service providers will continue to receive regular payments for services, CMS will prepare an accounting at the end of the year (beginning with year two of the pilot) of the actual spending versus the allowed spending based on a per-episode rate. Hospitals that exceed the allowed amount will see their year-end Medicare payment reduced by an equal amount, whereas hospitals that spend less are eligible for an incentive payment. In addition, CMS will set quality benchmarks that must also be met regardless of spending.

Many hospitals will struggle to navigate the post-acute care environment and select the most effective setting for patients. For post-acute care providers, this is a fantastic opportunity to provide leadership and guidance to local hospitals serving joint-replacement patients. PAC providers with extensive home health networks will be at a particular advantage, as this program provides an incentive to test out lower cost interventions, such a tele-therapy, remote home monitoring, and active case management as an alternative to extensive skilled nursing stays and potential hospital readmissions. For patients still within the 90 day window, skilled nursing facilities have the opportunity to provide a lower cost triage and stabilization environment for patients versus a repeat acute inpatient admission.

Initially, partnerships and narrow referral networks will likely be based on publicly available measures, like the Nursing Home Compare Five Star Rating System. This is only the beginning, however. As I’ve written before, narrow networks will soon give way to smart networks, built on actual value outcomes and cost data. CMS plans to share extensive spending and use data to eligible hospitals to help them navigate this new program before penalties begin to set in. Armed with this information, hospitals will likely shift their focus to outcome measures and quality factors that account for the biggest drivers of actual costs: least expensive setting, overall length of stay, functional improvement, and readmissions over the entire 90 day episode.

In the example to the right (taken from the Vantage Care Positioning System from Avalere Health), two area SNFs have significantly different LOS and rehospitalization rates, leading SNF A to cost more than $2,000 more per case, on average, than SNF B. As long as SNF B is able to maintain the necessary quality levels, hospitals will have a significant financial incentive to funnel patients to that location.

Going forward, there are additional avenues that offer even more potential to reduce costs and better serve patients, notably:

  • Respite care in assisted/ residential care communities, coupled with home health
  • Telerehab, with reduced frequency home health
  • Remote patient monitoring to increase security/ reduce risk for patients recovering at home
  • Incorporation of non-medical healthcare workers armed with clinical decision support and predictive analytics to guide services
  • Home care, meals services, and housekeeping support post-discharge to reduce risk of rehospitalizations or other complications.

The CCJR is likely the first of a new wave of mandated bundles from CMS, and may pave the way for similar moves by other payers. Hospitals, skilled nursing facilities, and post-acute care providers should view the joint program as a template to build upon in a value-based future rather than an aberration of fee-for-service to be minimized or ignored. Non-traditional players, such as home care, meal services, and other senior housing providers, should view the CCJR as a new market opportunity with significant growth potential ahead.

Wondering how the CCJR program will affect your organization?

The CMS Nursing Home Compare Five Star Update

Nursing Home Compare Five Star Rating

Since the Nursing Home Compare Five Star rating program was first launched in 2008, providers have approached it with a mix of trepidation, envy and awe. Using a set of complex statistical models, CMS awards between one and five stars to every nursing facility, with the goal of helping consumers make more informed and better care decisions. Unfortunately, its reliability is somewhat suspect, as most providers experience fluctuation in their star rating. According to a five-year analysis prepared by Abt Associates, only 3% of providers had the same star rating over the entire period, although 28% ended up with the same rating as when the program started. Almost 40% moved up or down one star over the five year period, while 20% moved two stars. Recently, CMS announced changes to the quality measure content and scoring methodology, costing about 8% of nursing facilities their five-star rating and creating unhappiness in the provider ranks:

LeadingAge Supports Transparency, But Still Finds Flaws in the CMS 5-Star Nursing Home Rating System
New Government Rating System Forces Nearly 1 in 3 Skilled Nursing Centers to Lose Coveted Quality Star
CMS’s confusing kick in the teeth

To understand what happened, first we need to understand how the score is calculated. You can read the CMS Technical Users Guide, or just follow along:

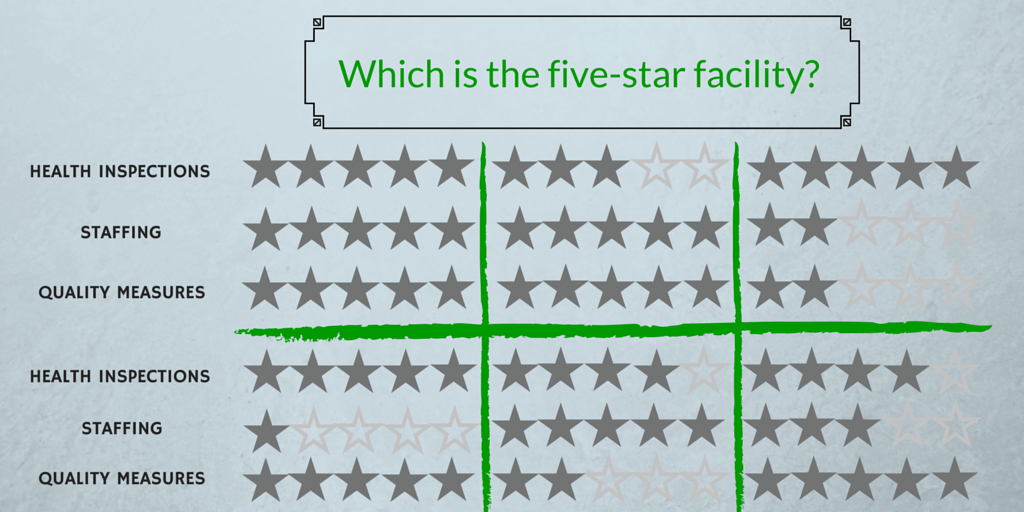
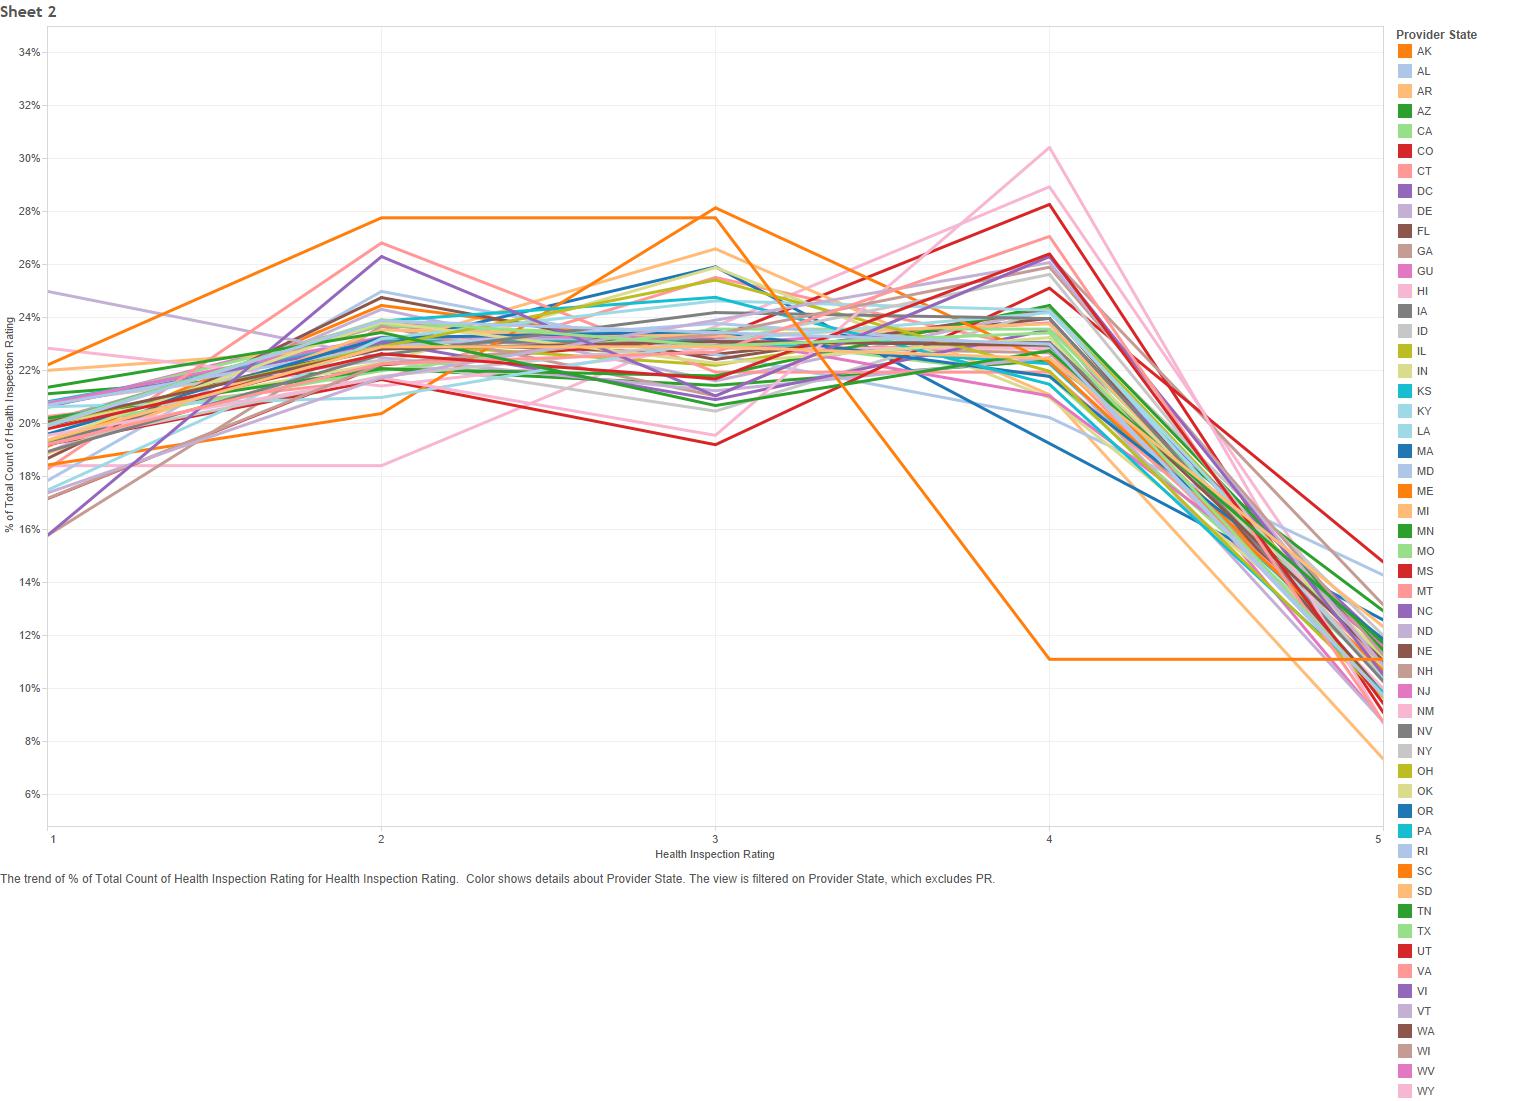
Health Inspections Five Star Rating

The health inspection rating is calculated from the number, severity and scope of deficiencies in the past 3 annual surveys, along with deficiencies from the last 36 months of complaint surveys. There is an aging component, as well, so that more recent surveys are weighted more than older ones. CMS then stratifies the star rating so that the lower 20% of nursing homes in each state receive one star, the middle 70% receive between 2 and 4 stars, and only the top 10% receive 5 stars. The actual state-by-state distribution looks like this:

Nursing Home Compare Five Star Rating

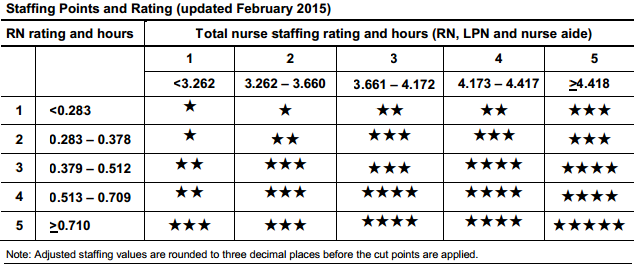
Staffing Five Star Rating

The staffing rating is based on reported staffing during the more recent annual survey, and looks at RN staffing and total nursing personnel (licensed nurses and nurse aides) adjusted by case-mix based on the RUG-III group. The star rating is determined according to the grid below:

Star ratings based on nurse staffing

And the state-by-state distribution looks like this:

Nursing Home Compare Staffing Star Rating

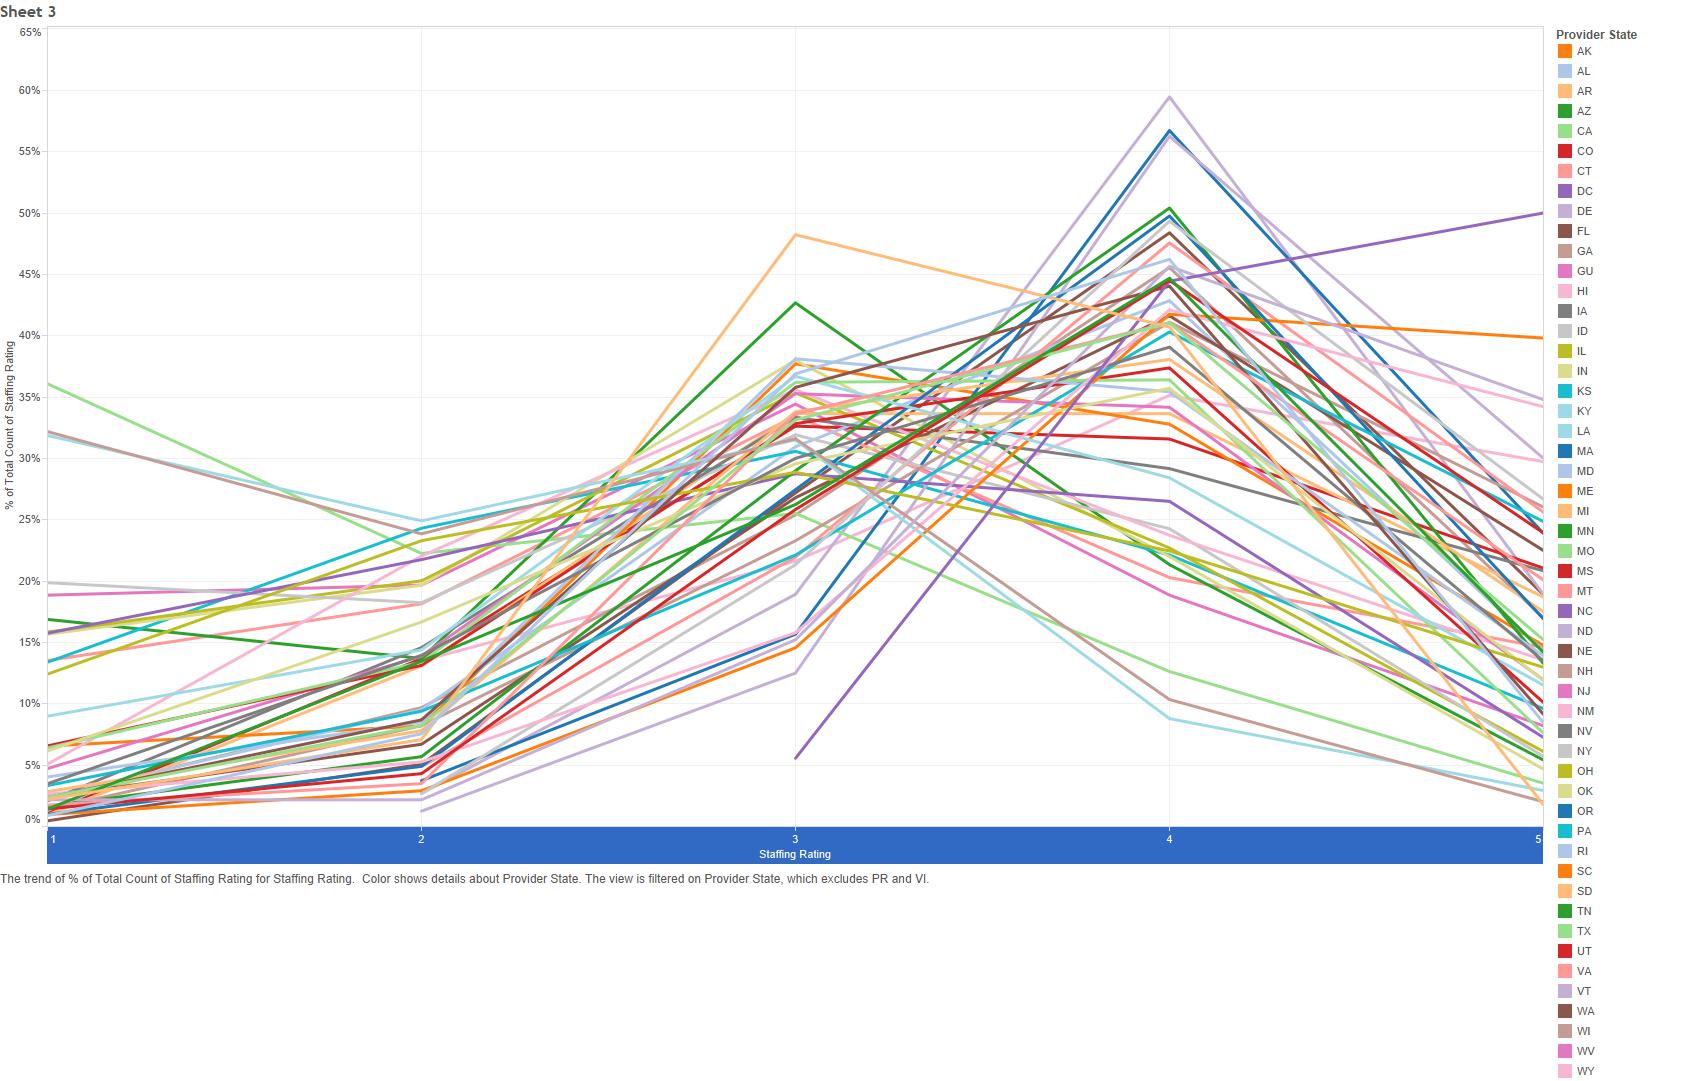
Alaska is excluded from the chart above. Why? Because 100% of Alaskan facilities received five stars for staffing.

Quality Measures Five Star Rating

The quality measure star rating is based on how the facility performs during the previous 3 quarters (9 months) on 11 of the 18 quality measures currently calculated by CMS:

Long-Stay Residents:
• Percent of residents whose need for help with activities of daily living has increased
• Percent of high risk residents with pressure ulcers (sores)
• Percent of residents who have/had a catheter inserted and left in their bladder*
• Percent of residents who were physically restrained
• Percent of residents with a urinary tract infection
• Percent of residents who self-report moderate to severe pain*
• Percent of residents experiencing one or more falls with major injury
• Percent of residents who received an antipsychotic medication

Short-stay residents:
• Percent of residents with pressure ulcers (sores) that are new or worsened*
• Percent of residents who self-report moderate to severe pain
• Percent of residents who newly received an antipsychotic medication

* Risk adjusted

The scoring methodology is somewhat complex, but essentially point values are assigned for each measure based on the nursing home’s performance compared to other nursing homes in the same state. Each quality measure is given equal weight, so the individual scores are simply summed. The total score is then applied to a scale to determine the star rating.

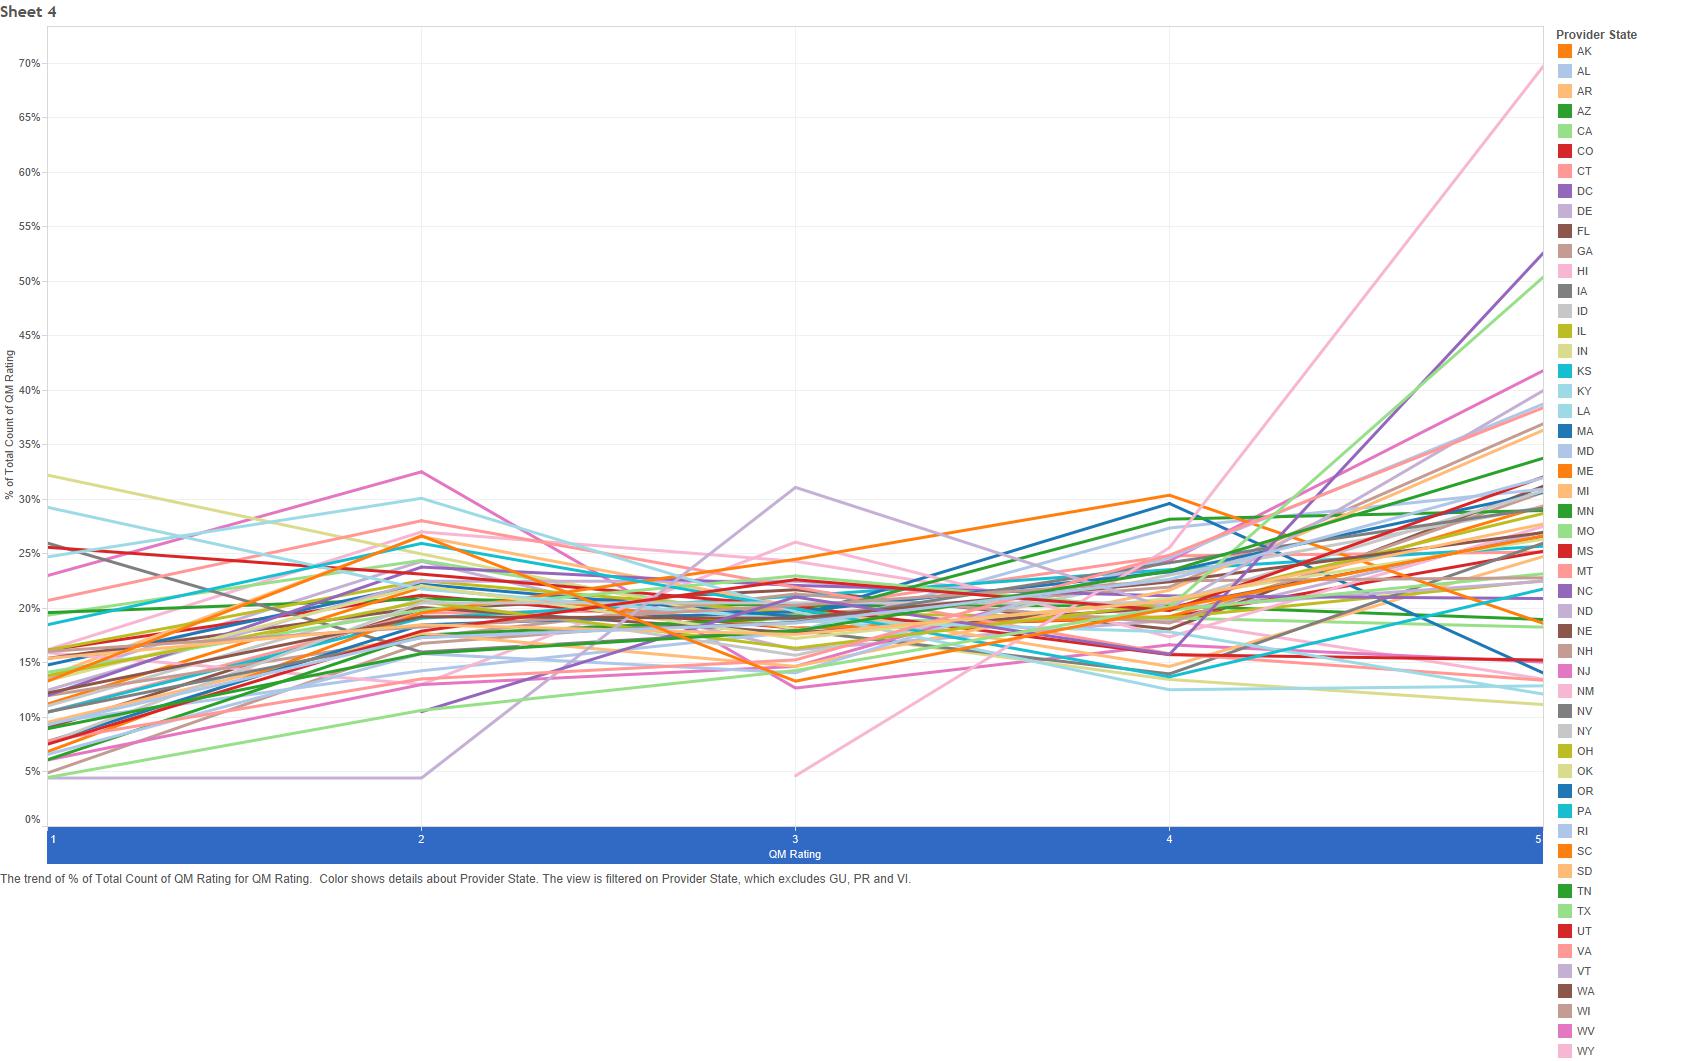
The current star distribution for quality measures, by state, looks like this:

five_star_QM

Overall Five Star Rating

With the complicated math behind, calculating the overall star score is easy. Begin with the health inspection rating. Next, add one star if the staffing rating is a four or five stars *and* the staffing rating is higher than the health inspection rating. Subtract one star if the staffing rating is one star. Finally, add one star if the quality measure rating is five stars,  or subtract one star if the QM rating is one star.

Special note: If a facility has a one star health inspection rating, its maximum overall rating is limited to two stars. Also, if the facility is in the Special Focus Program, its overall star rating cannot be more than three stars.

Why was the Recent Rebasing Done and Why are Providers Unhappy?

Since the fundamental methodology is intended to stratify facilities relatively evenly, but the actual scoring is based on a known point system, a gradual drift towards higher star ratings occurred over the past five years. Part of this is probably due to overall care improvements, and part of this is probably due to providers gaming (or at least selectively improving) parts of the system.

There is also a slight issue of state imbalance. Consider the District of Columbia:

five_star_DC


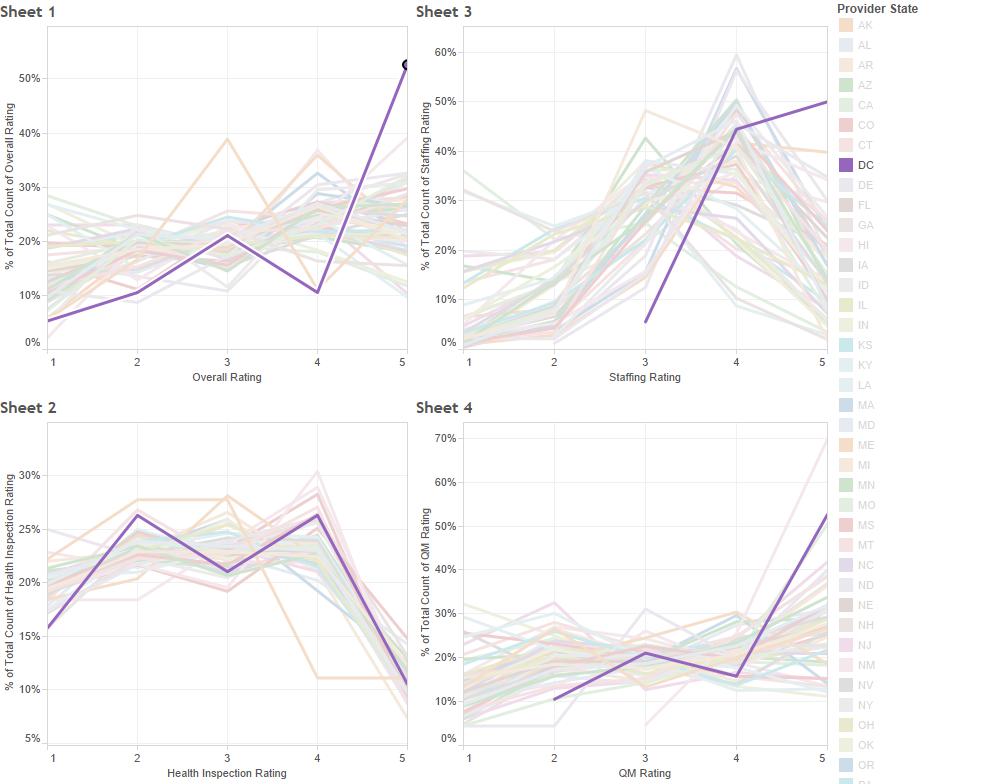
More than 50% of DC facilities hold a five star rating. Does this mean that DC providers provide phenomenal care? Perhaps, though it’s unlikely they provide significantly better care overall than providers in many other states. So how did so many providers get this coveted rating? As you can see above, the majority of DC providers received either four or five stars for staffing and five stars for QMs, which would lead to either one or two stars added to the health inspection rating. This points to a core problem with the five star system: CMS selectively stratifies measures by state, attempting to account for differences in state Medicaid policy and surveyor quirks, but this ends up causing some parts of the measure to reflect best-in-a-state results and others to reflect best-in-the-country results. Since the methodology isn’t standardized, it creates a real problem when comparing the five star rating of facilities located in different states.

What Does This Mean for Providers

CMS has clearly stated that it will continue to update measures and rebase scoring to promote continual improvement in nursing homes. While providers are understandably frustrated, this is simply the reality of healthcare today. Complaining about being ‘kicked in the teeth’ only furthers the perception that the nursing home field is behind the times. Instead, providers should see this as an opportunity to excel, not only in Nursing Home Compare rankings, but in service and care as well.

Understanding the methodology behind the five star rating system, as well as the state-level distribution, is a crucial first step to responding to this recent change. It should be clear that the health inspection score is the biggest driver of the overall score, and to reach a five star rating, a provider must be at or below the state average for survey deficiencies. Thus, it is critical, now more than ever, to build effective systems that embed quality processes into daily work. Customer service is also key, as most complaint surveys begin from unhappy residents or family members. Second, staffing hour cutoffs make it easy to compare current staffing metrics to the star rating system. For some facilities, adding slightly more staffing hours is an easy way to improve the star rating. Third, since quality measures are equally weighted, facilities can determine what measures are close to a higher point cut-off and work to improve those specific measures.


Ready to get started? So are we!